Transportation Disruption and Disaster Statistics (TDADS) – Updated Congestion Pie Chart
Transportation Disruption and Disaster Statistics (TDADS) – Updated Congestion Pie Chart
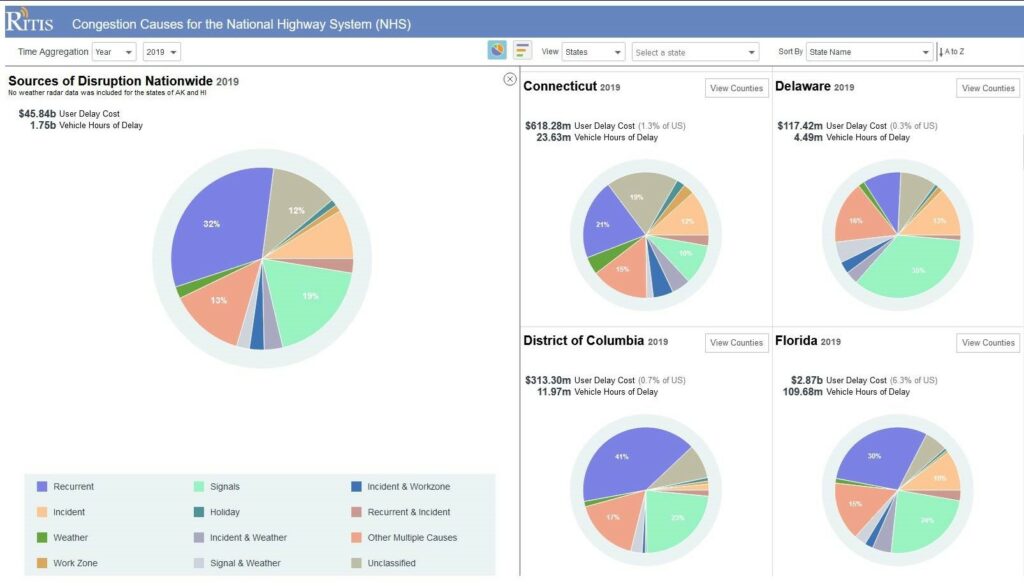
In cooperation with the Bureau of Transportation Statistics and the Eastern Transportation Coalition, the CATT Lab has deployed a web-based app that provides national and county-based insights into the causes of congestion for all roads on the national highway system. This new app updates the historic 2004 causes of congestion pie chart, which largely relied upon modeled data and was limited to just a national snapshot.
Today’s Causes of Congestion app leverages national connected vehicle data sources from companies like Waze and INRIX as well as weather data from the National Weather Service. The integration and analysis that was applied to develop the new county and state-based congestion metrics is the first of its kind to utilize real-world data.
Click the link below to explore the intuitive and dynamic data visualizations that quantify the causes of congestion in seven categories: (1) Recurrent Bottlenecks, (2) Weather, (3) Work Zones, (4) Incidents, (5) Signal Timing, and (6) Holidays, and (7) Unclassified, as well as combinations of the above.
https://congestion-causes.ritis.org/
Project Contact
Marygrace Parker
Director of Freight Program
The Eastern Transportation Coalition
Phone: 518.852.4083
Email: [email protected]
Web: freightacademy.org
- November 10, 2021 – Rebuilding the Causes of Congestion Pie Chart with Real-World Data
- November 21, 2019 | Transportation Disruption and Disaster Statistics (TDADS) – Congestion Pie Chart Webinar
- May 16, 2019 | TDADS Steering Committee Web Meeting
Copyright © 2026 All rights reserved.

